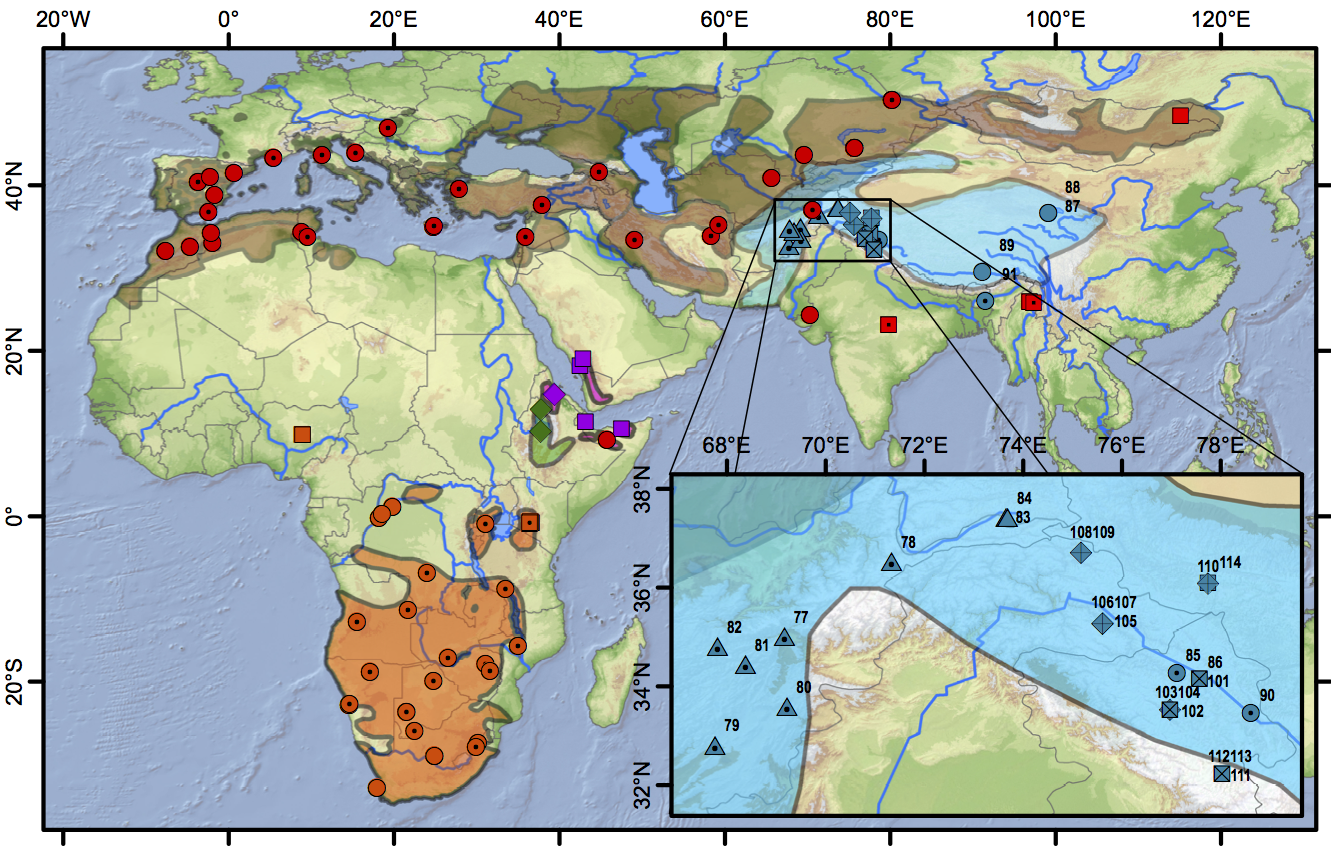
Figure 3 (from Stervander et al. 2016). Distribution map and sampling locations. Samples are denoted with coloured symbols; plain symbols represent full (or long) sequences of cytochrome b, symbols with a central dot represent samples sequenced for 300–400 basepairs (bp), and symbols with crosses represent samples sequenced for c. 100 bp. Distribution of resident Calandrella cinerea (orange; clade E circles, clade D squares), C. erlangeri (green diamonds), and C. blanfordi (purple; clade F diamonds, clade G squares), breeding distribution of C. brachydactyla (brown; clade A red circles, clade C red squares) and C. acutirostris (blue; clade B1 circles, clade B2 triangles, clade B3 diamonds, clade B4 squares). Clade names refer to Fig. 3 in Stevander et al. (2016). In the inset, the region holding four distinct C. acutirostris clades is shown (sample numbers refer to Table S2). Distribution data from BirdLife International and NatureServe (2014) modified for C. erlangeri and C. blanfordi according to Ryan (2004) and for eastern C. brachydactyla based on Gombobaatar and Monks (2011) and unpublished personal studies (which primarily exclude the Tibetan plateau from the previously assumed breeding range).