In a recently accepted paper in Molecular Ecology, we conclude that blue tits have colonised the Canary Islands from Africa no less than three times, but contrary to recent suggestions they did not back colonise mainland Africa from the islands. We combined traditional DNA sequencing on a large scale with massively parallel sequencing (“next generation sequencing”) and combine their respective strengths.
A demographic reconstruction reveals that the populations on the eastern Canary Islands Fuerteventura and Lanzarote have undergone recent population bottlenecks, while the long-term population sizes in northwest Africa have been stable, clearly supporting that the mainland populations have acted as a source for the colonisation of Fuerteventura and Lanzarote, and not the other way around.

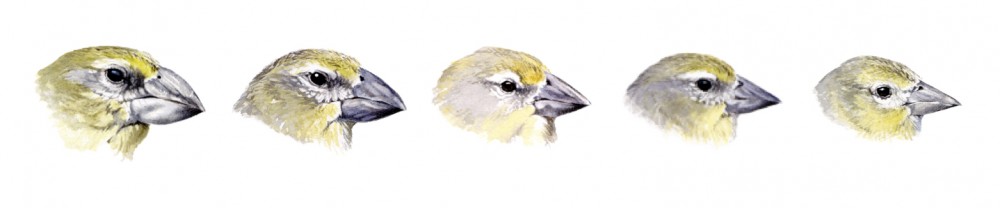
Coalescense species trees of the Cyanistes tit complex. Values along branches represent posterior probabilities (PP), and * signifies PP = 1.0. For further information, see our paper. Illustrations (c) Martí Franch.
The phylogenetic relationships between the blue tit populations of the Canary Islands are truly intricate. The first colonisation reached the northwesternmost island La Palma, and constitute a relict population which, surprisingly, is most closely related to a relict population in Libya. A second colonisation wave likely reached Gran Canaria or Tenerife, and spread to all central islands. The third colonisation reached the eastern islands, as described above. Thus, there are presently no less than six distinct populations on the Canary Islands!
Furthermore, we conclude that the access to new sequencing technologies, providing unprecedented amounts of genetic data, requires very careful handling. In another paper in the first issue of Molecular Ecology this year, a Norwegian group performed similar analyses as we did, on the same system. However, as we discuss in our paper, their coalescence analyses did not converge and the many of the results that they discuss are thus not valid.
Dear Mr. Stervander
I am, as you know, the first author of the study you mention in the last paragraph in this blog entry. Seeing as you, both here and in your article, conclude that our study is largely invalid I would ask you to qualify some of your statements. I refer to this particular passage in your article:
“In a recent study, Gohli et al. (2015) did employ massively parallel sequencing, but they only had access to degraded museum samples of the Libyan subspecies, which produced a phylogeny with low nodal support of the main clades. In addition, their coalescence-based species tree and demography analyses lack appropriate statistical support (i.e. species tree analyses converge poorly and most effective sample sizes are much too low), rendering published evolutionary interpretations unreliable.
When you refer to the “phylogeny with low nodal support of the main clades”, I assume you’re referring to figure #3 where we included Libya? I will concede that this phylogenetic reconstruction lacks support for the two major clades, but don’t you agree that your wording in the above paragraph fails to acknowledge that we have a phylogeny for the rest of the system which has perfect support overall?
Next, I would ask that you provide some detail on this statement: “In addition, their coalescence-based species tree and demography analyses lack appropriate statistical support (i.e. species tree analyses converge poorly and most effective sample sizes are much too low), rendering published evolutionary interpretations unreliable.” I assume you have switched to a different reconstruction here, without notifying the reader (the reconstruction you refer to in the first part of the paragraph has very high ESS values)? Further, what is your basis for stating that our ESS values are much too low? As far as I know, ESS values of > 200 is preferable, but >100 is also considered acceptable. You fail to provide a reference to this qualitative statement in your paper, so can you provide it here? PS. I am aware that many of our theta estimates (estimated effective population sizes) have ESS lower than 100, but the values that refer to the quality of phylogenetic reconstruction range from 105-167. Lastly, you say that our analysis converge poorly – what do you base this statement on?
I also find it surprising that you do not acknowledge the strength of our analysis compared to yours with regard to number of individuals. To reconstruct the evolutionary history of a complex system using single individuals as representatives of populations, as you have done with your next-gen data, seem somewhat hazardous to me. Your analysis of Sanger sequenced data of course alleviates the problem.
I hope you find the time to answer these questions. My co-authors and I find your paper to be very interesting and of high quality, and would think it very publishable without having to downplay the importance of our paper.
Best regards
Jostein
PS. I very much enjoyed the title of this blog post.
Dear Jostein,
Thanks for reading the post and the paper, and for commenting on it – it’s nice with a bit of scientific debate now and then! I’m glad you liked the blog post title, and I do understand that you may not have liked some of our comments as much. I think you ask some fair questions, and I’ll do my best to answer them as soon as possible. Stay tuned!
Best,
Martin
PS. I am sorry for my pic ending up next to your post – I have no idea how that happened, or how to undo it!
Hi again Jostein,
So, here goes! Here are some thoughts, and some replies to the points you raised.
Once we originally submitted our paper yours was not yet published, and we had therefore chosen not to make any reference to it for the time being (although you and I had both met and corresponded a bit about your study). After that, your paper was published while ours was in review, and for the revision we obviously both wanted and needed to discuss your study, and incorporate some of the similarities and differences concerning methods and results. There is plenty more detail that could have been put into it, but I tried to keep the revision short (apparently maybe too short).
I think that your analyses of sperm length is very interesting, and entirely novel to the debate of the evolutionary history of the Canary blue tits. Nevertheless, it presents a pattern that does not comply with the phylogenetic patterns that we both arrive at, since the La Palma population is more similar to European populations than to Afrocanarian ones. Indeed, La Palma’s affinity to European blue tits was also the emerging pattern that you originally suggested based on SNP analyses (at ESEB 2013), although I have learned from you that this changed once you later discovered a methodological error.
The points of critique I have regarding your study are these – and I apologise if they were not communicated clearly enough in the paper, or in the original short summary here on my webpage (the latter obviously being merely a short summary):
Nevertheless, you suggest, based on your results (probably also referring to Structure analyses), that they both are likely relict populations within the Afrocanarian clade. I would argue that this reasoning is somewhat circular, and that there is not very strong support for this in your data. (Nevertheless, I too believe this is a correct pattern, which both Päckert et al. (2013) and we recovered.)
I agree with you that there are no more quantitative rules or limits available than the guidelines stating that ESS should preferably be >200. In the FAQ for Beast2, for example, the answer to what ESS is adequate is “The larger the better. Tracer flags up ESSs < 100 but this may be liberal and > 200 would be better. On the other hand chasing ESSs > 10000 may be a waste of computational resources.” In Bouckaert’s and Bryant’s rough guide to SNAPP (pdf), they mention in section 6 that “An ESS of less than 100 is generally an indication that the chain has not converged for that variable yet (expNumRootLineages in Figure 8). When ESS is larger than 100, the next thing to check is the shape of the trace. If there are any obvious trends visible, or large fluctuations, this is generally a sign that the chain has not converged”. It is correct that ESS for the posterior of the tree in Figure 2 is >100, namely 104.7, but together with the shape of your trace plot (Figure S1) I would argue that your analysis has not yet converged properly (but probably would have with an extended run time).
Maybe more importantly, you present the theta values (reflecting effective population sizes) for all branches in Figure 3, irrespective of ESS values, and you discuss these theta values in the text, for example concluding that the Moroccan population by far has a larger genetic diversity (theta value) than any of the Canary Islands. However, your assessment of the theta values for the Canary Islands are not supported. One population displays an ESS value of 113, the remaining range from 14(!) to 75. I would certainly argue that these theta values should not have been drawn on the phylogenetic tree at all, because it gives a reader, who does not scrutinise supplementary tables, the impression that the values are valid for comparisons, just as you use them for comparisons. Indeed, out of the 20 theta estimates, 14 have ESS<200 and 12 have ESS<100.
Secondly, I think your interpretation of the use of Delta K is faulty in this case. You conclude that the population structure would best be explained by two clusters (an Afrocanarian and a Eurasian), since the difference in likelihood between K=2 and K=1 is the largest compared to all other increments of K by one. However, if your “population” consists of at least three accepted species, of which at least two are differentiated substantially morphologically, you would know a priori that K=1 should seriously misfit you “population”, since your data consist of at the very least 2 clusters. This misfit is also clearly reflected in the enormous change in likelihood between K=1 and K=2 describing your data. I would say the interesting changes in likelihood would be the ones between K=2 and K=3, K=3 and K=4, and so on. Unfortunately, these changes in delta K are obscured since the scale is entirely determined by the large delta K value for K=2 vs. K=1. Looking at the absolute likelihood, it seems as the likelihood make similar substantial increases between K=2 and K=3, and K=3 and K=4, after which it plateaus. To me, this would indicate that your data are better explained by three or four clusters, rather than two. That would also better agree with phylogenetic and phylogenomic analyses, as well as current taxon delimitation.
Jostein, you are right in how you interpret our critique, and I regret that it was phrased so concisely that it does not differentiate between the different parts referring to the different analyses. If possible to clarify this at the proof stage, I will do so.
I would not say that we try to downplay your study, though. We point out problems that are relevant in this breakpoint in time between using traditional and “next generation” sequencing. Many of us now make use of RADseq and other new NGS techniques, but with great power comes great responsibility… Or, phrased in this context, with huge datasets come requirements for very careful treatment of data, when we attempt new kinds of analyses. This is an important point to make to all of us who are transitioning from phylogenetics to phylogenomics. In this regard, I think that your study, unfortunately, constitutes a warning example. That’s a shame, because you have got a very impressive dataset (the lack of comparable Libyan samples aside), which is much stronger than our RADseq dataset on single population representatives. I certainly agree that your population sampling for the RADseq enables more elaborate analyses, and that only performing phylogenomic analyses on single representatives may be hazardous, but as you point out, we performed population scale analyses with our Sanger sequence multi-marker dataset.
Thus, we did not try to downplay your study to put our own study in a favourable light. While we obviously failed in communication and traded off clarity for brevity, I stand by the critique itself, because I think it is justified and because I think it is important to point out these problems to the community, so that we could learn from them.
At one stage, when I first learned that you were working on the Canary blue tits, and while both groups were both still running analyses, I suggested to Jan Terje that we could join forces rather than running a parallel race on the blue tits – since our materials would have complemented each other very nicely. I still today think that we could have produced an even stronger paper together, but Jan Terje regretfully declined such cooperation and referred to that research often gets better with some competition. So, here we are. I hope that our two studies, and this discussion, will both bring the knowledge about the evolutionary history of blue tits forward, and raise caution for researchers analysing large SNP datasets for the first time.
Best wishes,
Martin
Thanks for taking the time to reply to my comment Martin, I appreciate that. I will go through your answers point by point:
1. “…your analyses of sperm length is very interesting …. Nevertheless, it presents a pattern that does not comply with the phylogenetic patterns that we both arrive at, since the La Palma population is more similar to European populations than to Afrocanarian ones.”
That is indeed true, but I fail to see how this is a problem or concern. We point out that this relic population has a sperm length matching that of the likely source population, and discuss how this is in line with the notion that sperm morphology can carry a phylogenetic signal. Although not perfectly matching the phylogeny, I fail to see how these results can be viewed as discordant in any way.
2. “The museum material of Libyan blue tits did not allow you a very good data subset for analyses, and indeed the SNAPP analysis including Libyan samples (although in general converging nicely, purely methodologically) gives no support for the placement of either Libya or La Palma in the phylogenetic tree .…… you suggest, based on your results (probably also referring to Structure analyses), that they both are likely relict populations within the Afrocanarian clade. I would argue that this reasoning is somewhat circular”
We are very open about the lack of support in our SNAPP analysis of the Libya data set. When suggesting that both La Palma and Libya constitute relic populations, we are 1) referring to the placement of La Palma in our main phylogenetic analysis (not including Libya) and the Structure and COI analyses where Libya clusters together with La Palma, and 2) referring to the Packert et al study who suggested the relic population hypothesis in the first place. I fail to see how this is circular in any way.
3. “I persist in claiming that your main SNAPP analysis based on 2000 SNP’s (Figure 2[a], Table S4, Figure S1) has converged poorly, and that you present results that are not valid. As for convergence, in Figure S1 you provide a good example of a run that does converge well – the trace of the subset with 166 SNP’s – which can be compared to the trace from the main analysis of the 2000 SNP dataset. In the latter case, I would say that the trace illustrates deviations from stationarity. However, this is a purely subjective visual assessment of the traces, and it is better to refer to effective sample sizes (ESS).”
This is as you say a purely subjective assessment of the traces, and I am surprised that you feel comfortable with making such assessment given that you have not seen our tree-sets. Although there is some variation in the trace, I can tell you that this is only due to variation in the topology within the Gran Canaria, Tenerife and La Gomara clade (which is discussed in the paper), and small differences in node heights. To ensure you that our analysis are not jumping between different topologies, here is a link to a pdf showing a densitree figure (all phylogenetic trees) and the maximum clade credibility trees from four parallel runs in SNAPP. Link: https://www.dropbox.com/s/hee2uk9b0jmapxv/convergence.pdf?dl=0 Hopefully, this is sufficient evidence to persuade you that our analysis are not invalid.
4. “When ESS is larger than 100, the next thing to check is the shape of the trace. If there are any obvious trends visible, or large fluctuations, this is generally a sign that the chain has not converged”. It is correct that ESS for the posterior of the tree in Figure 2 is >100, namely 104.7, but together with the shape of your trace plot (Figure S1) I would argue that your analysis has not yet converged properly (but probably would have with an extended run time).”
To evaluate a trace without looking at the actual result files is, as I mention above, problematic. If there is variation in the trace, that indeed reflects some variation in the posterior. However, if this variation reflects uncertainty in parameters that is of little importance, or on a scale that has no significant impact on the conclusions drawn, it does not constitute a problem. Granted, we could have done a better job of reporting the details of our results (as in the pdf I appended above), but I still find it surprising that you and your coauthors were comfortable with this rhetoric given your superficial knowledge of our results.
5. “Maybe more importantly, you present the theta values (reflecting effective population sizes) for all branches in Figure 3, irrespective of ESS values, and you discuss these theta values in the text, for example concluding that the Moroccan population by far has a larger genetic diversity (theta value) than any of the Canary Islands.”
I agree that this information should not have been shown on the figures, seeing as many do not have acceptable ESS values. However, we mention only one thetha estimate in our discussion, namely that of the Moroccan population. The ESS value of this estimation is 2308. One cannot compare supported to non-supported results of course. However, there are three theta estimates that have ESS > 2000, two that are > 200 and three that are > 100. So we can compare the Moroccan theta estimate to seven others. We should have been more careful when presenting these results, but these results constitute a single sentence in the discussion; it hardly constitutes the foundation of our study.
6. “the interpretation of your Structure analyses are somewhat problematic…..the one replicate with the highest estimated likelihood out of ten for each K level is a bit confusing. I would really have liked to assess the variation in cluster assignment between replicates – especially given the results for higher K levels…. When you examine the figure carefully, you quickly become aware that for many K levels, number of actual “real” clusters recovered (at least in that replicate shown) is lower. This should be because some samples are only assigned to a cluster (K) with a very low probability, whereas the main probability is that it is assigned to another cluster. Thus, the number of “real clusters” for K=5 is 4, for K=6 5, K=7 4 again, K=8 6, K=9 5, and K=10 4. Is this representative for the other replicates as well, and how large was the variation?”
We chose to show only single iterations per K-value because including ten iterations over ten K-values would result in a figure with 100 structure plots. We actually point out in the text that certain K values were not shown due to variation in likelihood values between iterations. There was little variation in likelihood between the reported K-value iterations, and we of course evaluated whether the results were the same for different iterations.
Can you explain why the number of “real” clusters, as you say, being lower than the K prior is an issue? We report which populations were being favored at different K values. That Structure does not introduce populations at the same rate as the increasing K prior is neither surprising nor a problem.
7. “I think your interpretation of the use of Delta K is faulty in this case. You conclude that the population structure would best be explained by two clusters (an Afrocanarian and a Eurasian), since the difference in likelihood between K=2 and K=1 is the largest compared to all other increments of K by one………. I would say the interesting changes in likelihood would be the ones between K=2 and K=3, K=3 and K=4, and so on. Unfortunately, these changes in delta K are obscured since the scale is entirely determined by the large delta K value for K=2 vs. K=1. Looking at the absolute likelihood, it seems as the likelihood make similar substantial increases between K=2 and K=3, and K=3 and K=4, after which it plateaus. To me, this would indicate that your data are better explained by three or four clusters, rather than two. That would also better agree with phylogenetic and phylogenomic analyses, as well as current taxon delimitation.”
We simply report what Delta K indicates. Along with this we extensively discuss all results from the Structure analysis, including the mean likelihoods. Here is a sample from our article: “The mean likelihood, which should also be given attention when interpreting results from Structure (Evanno et al. 2005), reached a plateau at K = 4 where La Palma and a group containing Morocco and…” We chose to perform the analysis in Structure with no priors, and we included K=1, which is a necessity to evaluate the support for K=2 using the Delta K method. I am sure you agree that not evaluating whether K=2 is best supported in a two-species system is not good practice. We were able to evaluate the support for K-values >2 using the mean likelihood.
It would seem that you have an a priori idea of that K>2 better reflecting other results and current taxonomy. 1) We feel that such considerations should not be made when deciding on analytical approaches, and 2) that K=2 not supporting other results and taxonomy is simply wrong; it reflects the species delimitation.
It would seem that you mainly have issues with our discussion and reporting of Structure and not the results per se. How does that make our results invalid?
8. “with huge datasets come requirements for very careful treatment of data, when we attempt new kinds of analyses. This is an important point to make to all of us who are transitioning from phylogenetics to phylogenomics. In this regard, I think that your study, unfortunately, constitutes a warning example.”
I fundamentally disagree.
Best wishes
Jostein
Time flies, and I realize I haven’t replied to Jostein’s latest comment. For now, we can just agree that we disagree, and maybe I can elaborate on the matter in the future. Until then, or until anyone else would like to comment on this post (please contact me directly about it!) I will disable further comments, since this post has turned out to attract copious amounts of spam comments every day. Cheers!